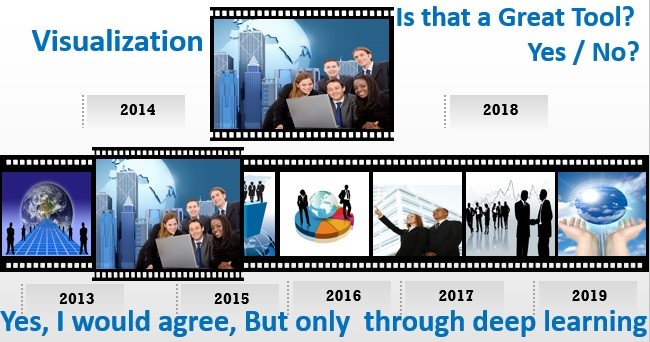
Visualization is the representation of an object, situation, or set of information as a chart or other image. For example, video systems allow visualization of the entire gastrointestinal tract. It is a helpful technique for relieving stress. Visualization today has ever-expanding applications in science, education, engineering (e.g., product visualization).
Actually, the term Visualization is used to mean different things in different contexts, and even Visualization that is based on data can be done for different reasons and with different goals.
Irrespective of the Agile Method or Methodology that we use Visualization is one of the best tools that can be used effectively. Lean Kanban University’s Certified Kanban Training Program (One Day) is covering Visualization in deep with many Practical Scenarios, Simulation etc. This course also covers many Tools & Techniques that can be applied to conduct more effective Daily Stand-up Meetings & Other Weekly/Bi-weekly Meetings. Participating in this course will enable you to create powerful questions by adding more items to your existing question/expected answer criteria’s.
There are few sample diagrams for your reference: What’s there in the below diagrams compared to what we practice in the course is the tip of the iceberg.


This is just the tip of the Iceberg. If you wanted to become an expert in this, please feel free to Write to nadia@diaame.com or Call +91 914 802 6666 if you want to up-skill and increase your professional status with globally accepted credentials (badge, certificate etc.). Also visit: https://www.hangoutagile.com/blog to see more interesting articles.
Success in management requires learning as fast as the world is changing.
!!! -:) Happy Learning -:) !!!