Opening Thoughts
How Do You do the Metrics Selection, Collection, Analysis, Representation or Reporting?
Corrective Actions & Proactive Steps Should Always be Effective Because You will be Judged by that Tomorrow? – Isn’t It?
So You Should be Smart Enough to Choose the Right Metrics, Corrective Actions & Proactive Steps Applicable to Your System (Project / Program / Portfolio/Services/Enterprise). In fact, It is Simple & No Rocket Science Involved at all – You Should be Smart Enough to Understand the Trick!
If I Can Do, You Can Also Do – As Simple As That…
But, Beware of the Usual Behavior of Human Brain – The Tendency to Make things Complex through One or the Other Way, Until You Get the Strong Base Understanding fo What You Do!
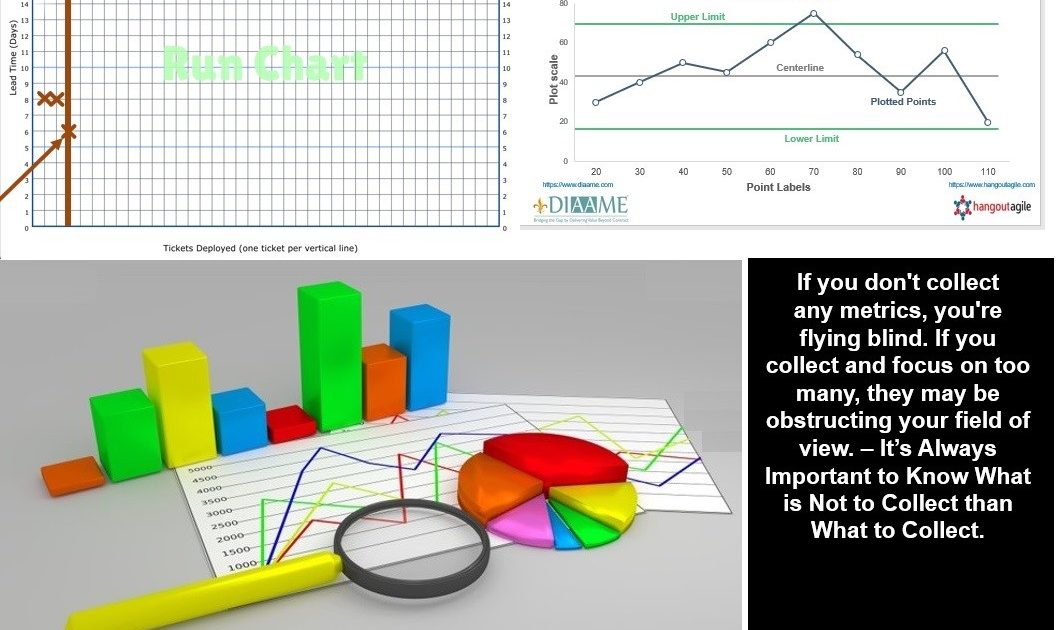
Control Chart & Run Chart is One of the Best Data Representation Techniques Used in Kanban.
A Run Chart is a Graphic Display of Process Data Over Time. This Simple Chart is a Single Line Plotting Some Value Over Time.
A Control Chart is a Graphic Display of Process Data Over Time & Established Control, Which has a Centerline that Assists in detecting a trend of plotted values toward either Control Limit.
Both Charts Will Help You to:

- Answer Where does Your Project Process Stand?
- Answer How is the Process Running this Week Compared to Last Week? Worsening/Deteriorating or Improving?
- Identify trends or errors in the product or the process – An Essential Tool for Managing Quality.

The Data CollectionFrequency/Interval & Chart Preparation Frequency / Interval, I am Completely Leaving that Decision to You and Of course, you are the Ultimate Decider Considering the Nature of Your Assignment or the Boundary of Your System.
Let’s do a Deep Dive on the Run Chart in this Article, Is that Interesting & Are You Ready? If Yes, Let’s Begin 🙂
A Run Chart Will Provide You Plenty of Information for Your Analysis:

- The Upward and Downward Trends of a Process
- A General Picture of a Process
- The Trends in the output of the process Followed in Your Project / Assignment.
- Identify the non-random pattern in the behavior of the process over some time.
- It shows the variation in a single data group over some time.
Let’s Take a Simple Example Assuming that You are Playing the Role of a Typical Customer Relationship Manager or Program Manager Wanted to Communicate the Actual Progress of the Project with the Planned Progress to the Customer or Senior Management. You will be Able to Represent it Using Run Chart.
What is Your Requirement in this Particular Example?
To Communicate the Actual Progress of the Project Compare to the Last Baselined Version of the Project Plan (Twenty One Months)

Let’s Discuss Some of its Benefits:
- Do You Think It’s Very Easy to Draft?
- Do You Think It’s Easy to Analyze and Interpret?
- Does This Require Much Technical Skill?
In My Opinion, It’s a Very Simple & Straight Forward Representation of Data. What do You Think?
Let’s Take Another Interesting Example:

The ICC World Cup 2019 is following Round Robin Method. There are Chances that India & Australia can Come Face to Face in Semi-Final or Final. Before that Let’s Analyze the above Run Chart Used to Represent the Scoring Trend of these Two Teams:
- As a Captain or Leader or Coach, What Can You Analyze about Your Team’s, Competitors Performance, the Particular Match, the Character of the Pitch, etc.?
- What is the Trend of Runs Scoring, Wicket Falling, Strike Rate of a Team Member, Run Rate, etc. in the Starting Overs, Middle Overs, Last Overs, Against Leg Spinners, Off Spinners, Fast Bowlers, Medium Pace Bowlers. Similarly Looking at the Charts Can Trigger Many Questions in Your Mind. Isn’t It?
- Post Analysis Will Give You Plenty of Key Points that Can be Included in the lessons Learned Repository of this Match (Round Robin Phase)?
- This will enable you to Take Data-Driven Decisions, Corrective Actions & Proactive Steps for the Upcoming Match (Final or Semi-Final)?
As Team Members, Scrum Masters, Agile Coaches, Transformation Leaders, We Work on Multiple Assignments Based on Business Need. Isn’t It?
- What Value It Can bring If You Prepare a Single Run Charts for all Your Past & Present Assignments with Similar Patterns or Cadences?
- Do You Think, That Can Provide Input Parameters with More Value for Performing Various Experiments in Your Upcoming & Ongoing Assignments?
I am Sure that Using Run Chart Can Trigger Many Questions Enabling You to Take Plenty of Corrective Actions & Proactive Steps.
But Not Limited to. Isn’t it? Why Can’t We Use the Same for Representing our Career Growth on An Yearly Basis?
I Believe, It Is Always Interesting to Know the Trend of our Career Growth Isn’t It? That Means this Can be Used for Your Personal & Professional Purpose. More Interesting? Yes, Run Charts are Applicable Every Where.
But Be Smart Enough to Get More Value – “With Minimum Number of Metrics” Applicable for Your Particular Project.
Be Specific on What “To Use” & What “Not To Use”?
This Can Save Plenty of Time & Time Is the Only Powerful & Precious thing in this World (Data Collection, Analysis, Reporting, Corrective Action, Measure, Analyze, the Cycle Follows as it is) Isn’t it?
By the Way, How do You Decide Your Self in Choosing Run Chart for Your Assignment?
- Asking a Single Question to Yourself Will Suffice:
Where is Your Assignment (Enterprise / Services/Program/Project/Process Followed in Your Project or Program / Transformation etc.) or Even Your Career Growth Heading To? – Improving or Worsening?
“Now, You are Empowered with Enough Information to Decide Whether to Choose or Not To Choose Run Chart for Your Assignment? Yes, or No – Over To You. Take the Right Decision & Move Forward.”
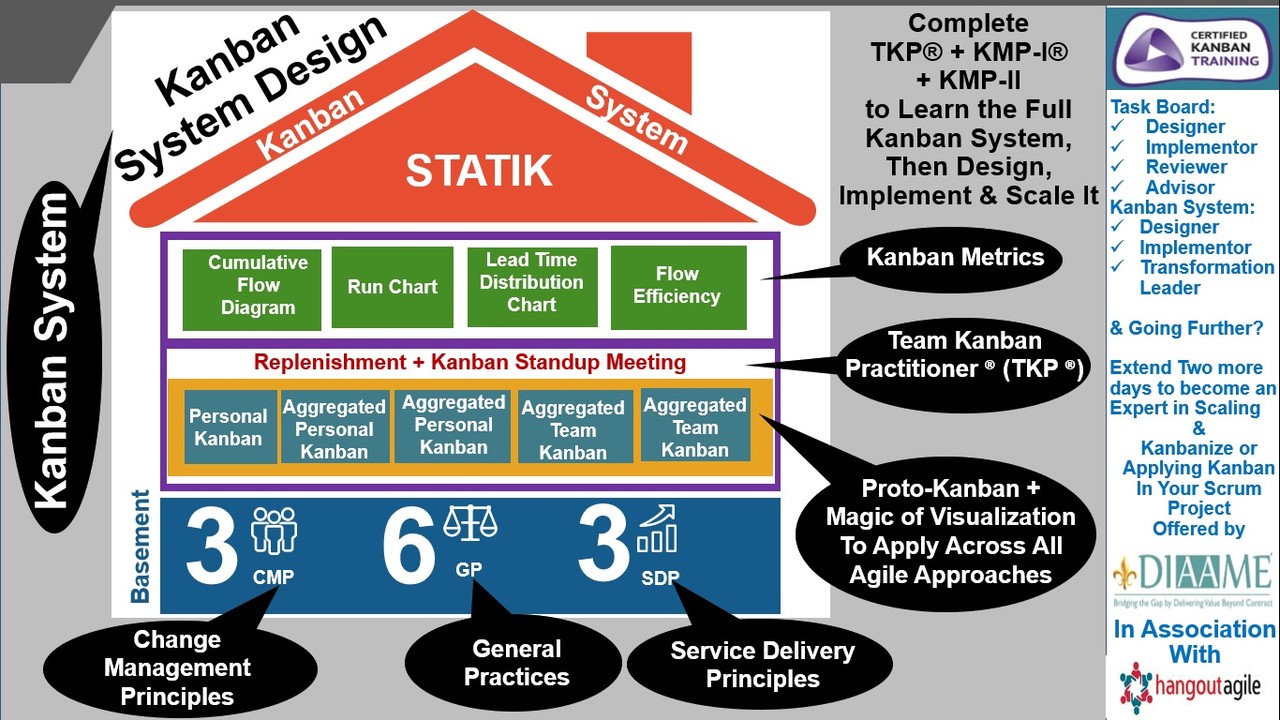
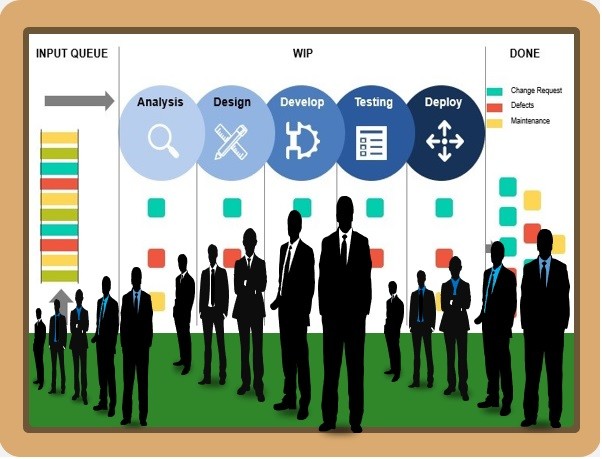
How Can We Use the Run Chart Effectively in a Full Kanban System?
Questions:
- Do You Have a Clear Understanding About the Classes of Services(CoS)? Yes/No. If the answer is No!, Time to Refer Part-I of this Article Series
- Do You Have a Clear Understanding About the Lead Time? Yes/No. If the answer is No!, Time to Refer Part-I of this Article Series
- Do You Have a Clear Understanding About the Cycle Time? Yes/No. If the answer is No!, Time to Refer Part-I of this Article Series
Run Chart Can be Used To Represent the Lead Time Variations of Different Backlog Items Pertaining to Your Designed Classes of Services in the Kanban System to Ensure.
Continuous Learning, Continuous Improvement, Evolutionary Growth
The Run Chart Tracks the Lead Time of Every Backlog Items Deployed – One Ticket Per Vertical Line on Your Chart. This Will Display the Variability Present in Your Kanban System.
This May Also Suggest Couple of Other Important Data Points Which May be Opportunities for Further Analysis:
- Trends & Outlying Data Points
- Performance of Your Kanban System for Each of the Classes of Services You Offer
More Interesting? If Yes, That is What You are doing hands-on during My Kanban System Design or KMP-I Class. To Get Hands-on Experience to Become an Expert in:
- Choosing the Right Metrics for Your System
- Applying, Analyzing, Representing, Reporting
- Defining & Executing the Right Corrective Action for Your System
- Proactively Managing the Upcoming Challenges & Many More
By the Way, As We All Know, Living in this VUCA World in the era of“Information Technology Revolution”, Plenty of Data is available everywhere – The Moment You Type in Your “Key Words”, You would be getting “Huge Amount of Information”, But It is Important to Know:
- [LHS] What to Choose & [Key Word] What Not to Choose? [RHS]
- [LHS] What is Authorized & [Key Word] What is Unauthorized? [RHS]
- [LHS] What is Authenticated & [Key Word] What is Unauthenticated? [RHS]
What will be the Impact, If we end up in Choosing the [RHS] Part from the Information Pulled for You by Your Search Engine?
This Can Cause Your Career/Credibility to Go for a Toss. This “Decision Part” I am Leaving to You “Think, Make the Right Decision & Move Forward”.
Another Interesting Chart is Coming to You in My Next Article The “Control Chart” In the Mean Time,
If you are interested to Become An Expert in Choosing the Minimum Metrics Applicable to Your Particular Project & Get More Value by Attending the Course Series “Alternate Path to Agility” Certification Program offered by Lean Kanban University (LKU) (Click here to Learn More)! or Reach out to me through Cell # – +91 914 802 6666 or 914 842 6666.